See Your Data at a Glance

A4B CMMS dashboards give you real-time visibility into asset performance and maintenance operations.

What you'll see:

KPI Cards: Total assets, active maintenance tasks, completion rate, overdue tasks

Trend Charts: Maintenance activity over time, asset status breakdown, warranty timelines

Quick Actions: Jump directly to overdue tasks, upcoming maintenance, or asset details

Mobile-Responsive: View dashboards on any device

User Decision Note: Dashboard screenshots are static images (not interactive). The live dashboard in your A4B account is fully interactive with drill-down capabilities.

Asset Activity Tracking & Reporting

Monitor asset changes, track maintenance performance, and export data for analysis. Keep detailed records of asset lifecycle events.


Activity Logging

Track every asset change. Detailed activity log with timestamps and user attribution for asset creation, updates, and state changes.

Performance Dashboards

Monitor asset health. Visual dashboards showing asset values by state, warranty timelines, and maintenance task summaries at a glance.

Data Export

Export for analysis. Download asset and maintenance data as CSV files for external reporting and integration with your existing tools.

Ready to gain complete visibility into your assets?

Track every change with professional audit trails

Key Performance Indicators Explained

Completion Rate

What it is: Percentage of scheduled maintenance tasks completed on time

Why it matters: Measures preventive maintenance effectiveness and team performance

Industry benchmark: Target 85-95% for most facilities

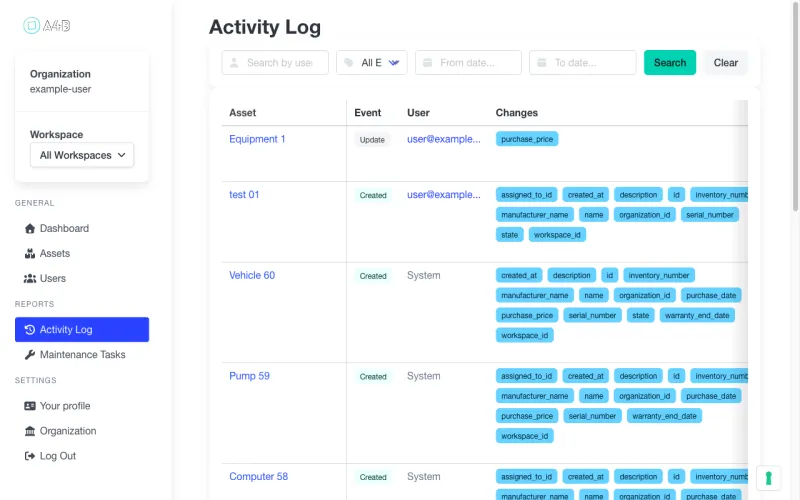
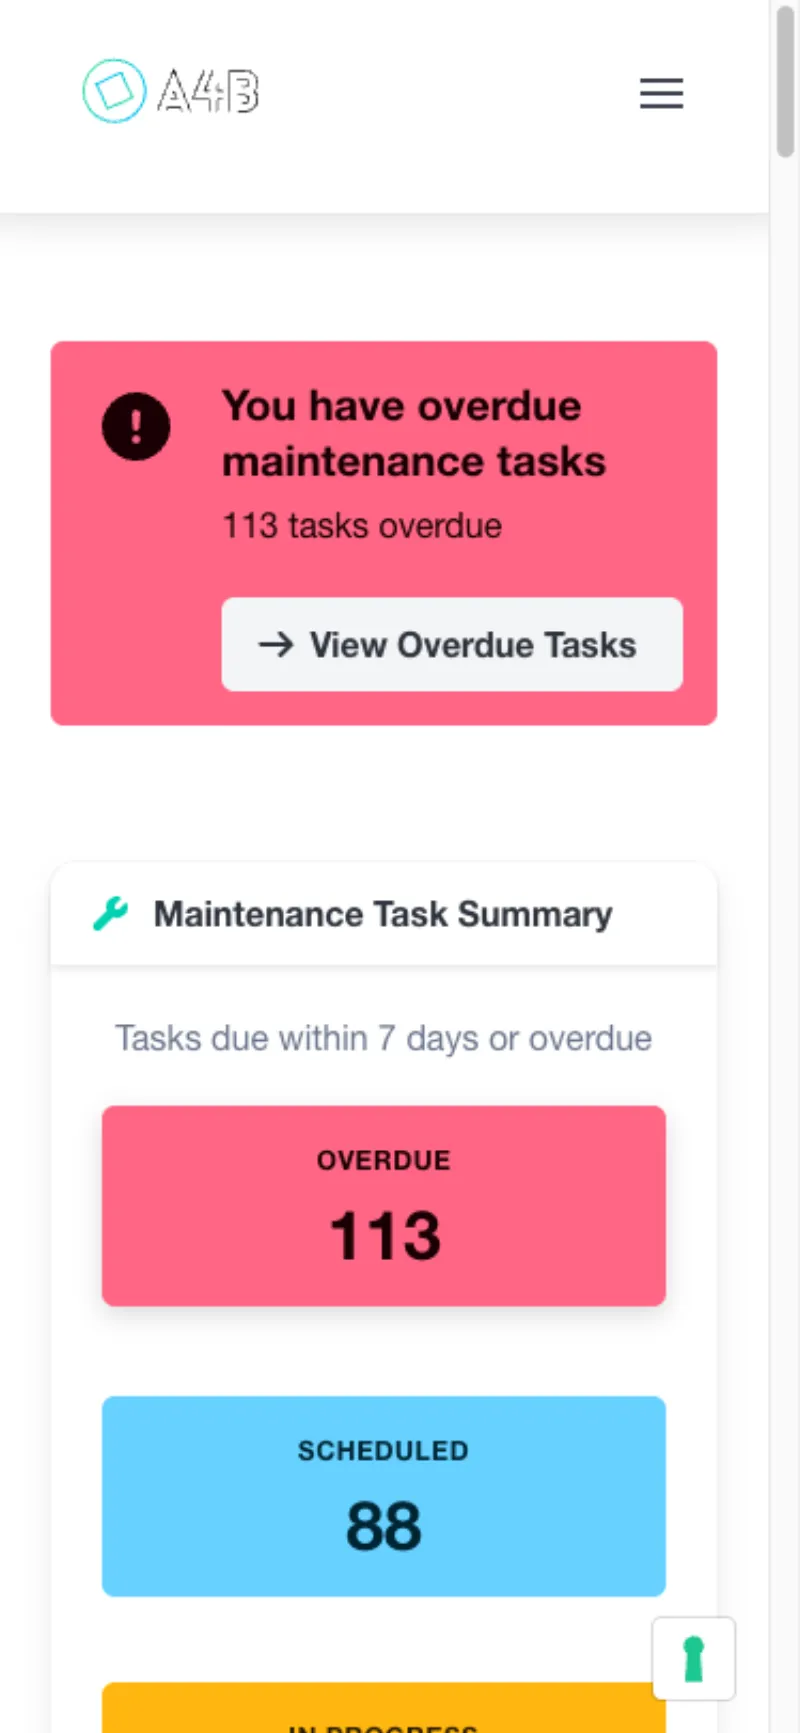
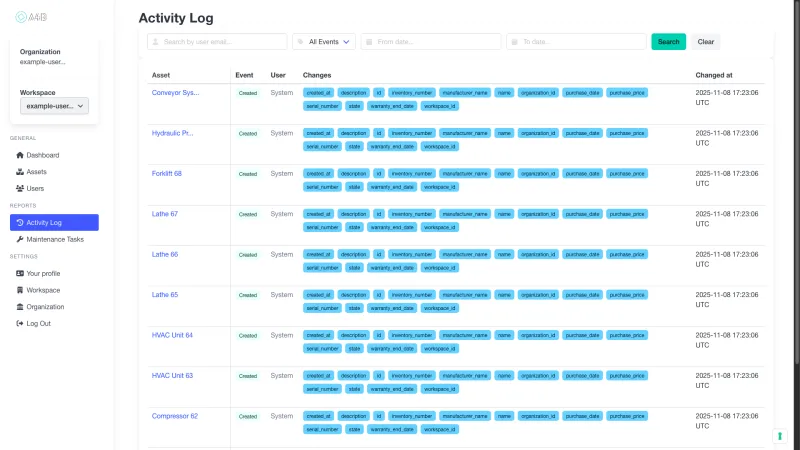
Track in A4B: Real-time completion rate displayed on dashboard KPIs

Overdue Tasks

What it is: Number of maintenance tasks past their due date

Why it matters: Highlights immediate priorities and potential risks

Industry benchmark: Target less than 5% of total tasks overdue

Track in A4B: Dashboard alerts highlight overdue tasks with priority indicators

Asset Utilization

What it is: Percentage of time assets are in productive use vs maintenance/stored

Why it matters: Maximizes ROI on equipment investments and identifies underutilized assets

Industry benchmark: 70-85% for manufacturing equipment, varies by industry

Track in A4B: Based on asset status tracking (in_use, maintenance, available, stored)

Download Sample Reports

See exactly what you'll get before you sign up

📄 Asset Inventory Report (PDF)

Complete list of all assets with status, location, last maintenance date. Perfect for audits and insurance.

Download sample PDF

📊 Maintenance Activity Log (CSV)

Every maintenance task with date, assigned user, completion status, and notes. Export to Excel for analysis.

Download sample CSV

All sample reports use anonymized data for demonstration purposes.

Dashboard & Reports Gallery

Dashboard Overview (Desktop)

A4B CMMS dashboard showing real-time KPI cards with total assets, active maintenance tasks, and completion rate percentage

Caption: Real-time KPI cards show total assets (125), active maintenance tasks (42), and 87% completion rate. Pie chart breaks down assets by status, bar chart shows maintenance trends over 6 months.

Dashboard Mobile View

Mobile responsive dashboard showing KPI cards and charts optimized for phone screens

Caption: Fully responsive dashboard adapts to mobile devices. All charts and KPIs accessible on phones and tablets for field technicians.

Note: All screenshots are static images for demonstration. The live A4B CMMS dashboard is fully interactive with clickable charts, drill-down capabilities, and real-time data updates.

Reports & Analytics FAQ

Everything you need to know about tracking and reporting on your assets

What kind of reports can I generate?

Generate asset performance reports, maintenance cost analysis, warranty expiry timelines, and activity logs. All reports can be exported to CSV for further analysis or compliance documentation.

How detailed is the activity tracking?

Every asset change is logged with timestamps, user attribution, and field-level details. See exactly who made what changes and when, providing complete accountability for asset management decisions.

Can I track asset performance over time?

Yes! Monitor asset values by state, maintenance costs, warranty status, and performance trends. Visual dashboards make it easy to identify patterns and optimize your asset portfolio.

Is the data suitable for compliance reporting?

Absolutely. The detailed audit trail with timestamps and user attribution meets requirements for asset tracking compliance. Export comprehensive reports for regulatory submissions or internal audits.

How do I share reports with my team?

Export reports as CSV files for easy sharing via email or integration with your existing business intelligence tools. Role-based permissions ensure team members see only the data they need.

Can I customize the dashboard views?

The dashboard automatically displays the most relevant information: asset values by state, upcoming maintenance, and recent activity. This provides instant visibility into your asset portfolio health.

Ready to gain insights into your assets?

Built for Professional Asset Management

Trusted capabilities that modern maintenance teams rely on

Enterprise Security

Encrypted data & daily backups

Cloud Hosted

Professional infrastructure

Team Focused

Built for collaboration

Mobile Ready

Works anywhere, any device

Ready to modernize your maintenance approach?