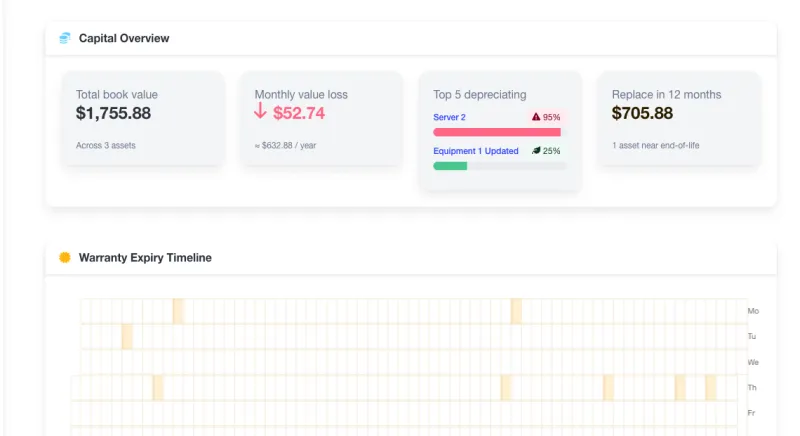
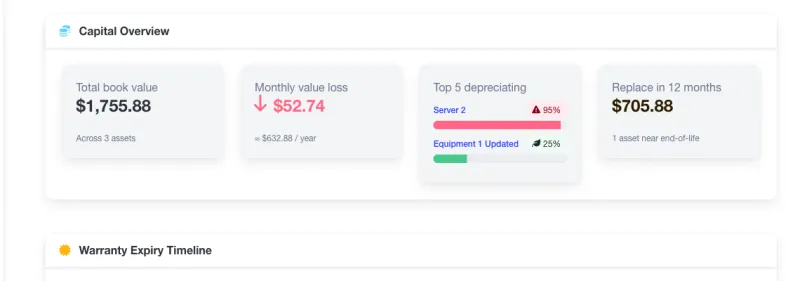
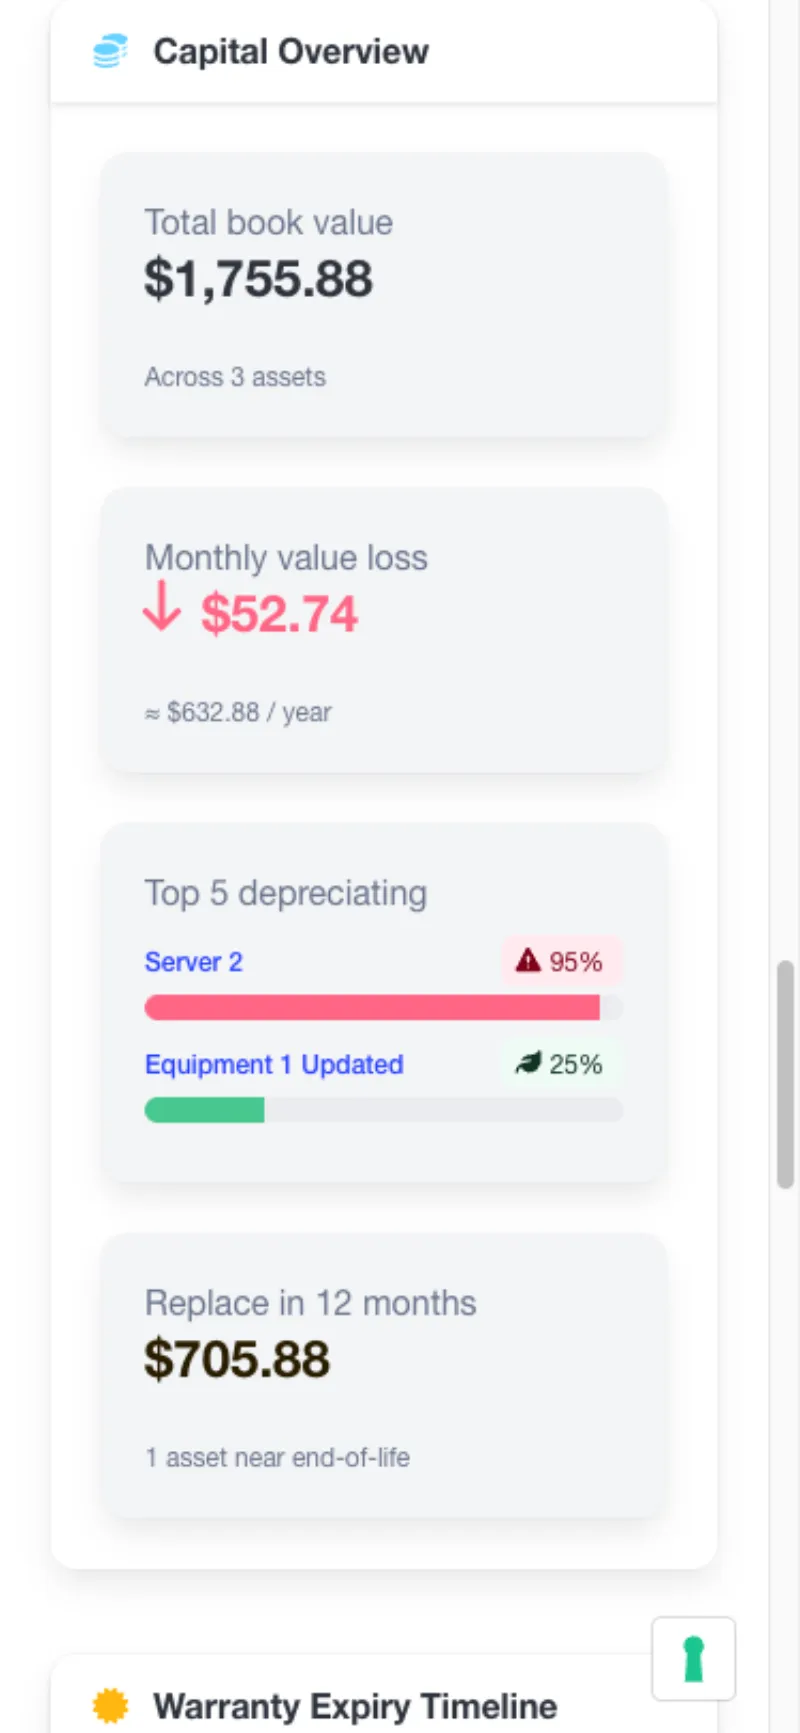
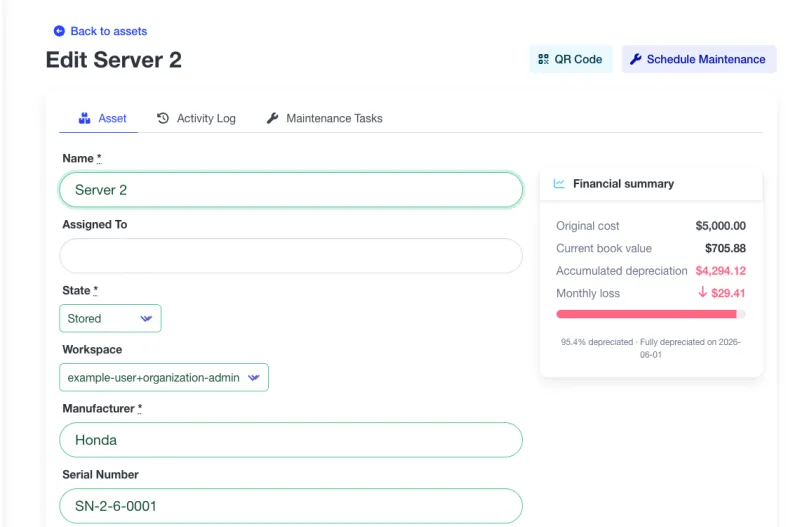
Track the book value of every asset, the monthly depreciation of your fleet, and the replacement budget you'll need in the next 12 months. Managerial depreciation, not tax accounting — built for the people running the equipment, not the people filing returns.
Financial data visible to organization admins only.
Admin view
Every facility has this problem. Most solve it with a spreadsheet that's out of date by the time it gets forwarded.
Someone updates the depreciation sheet once a year — and it's already wrong the next month. New assets show up. Old assets get retired. Book values slide. The spreadsheet doesn't.
A $40,000 generator bought in 2019 is not a $40,000 asset today. When a finance team asks what the fleet is worth, 'what we paid for it' is the wrong answer — but often the only one the maintenance team has.
Three machines reach end-of-life the same quarter and no one flagged it six months earlier. The replacement ask lands on the CFO's desk with zero runway, and the answer is 'next year'.
A single Capital Overview widget on your dashboard shows the four numbers operations leaders actually ask for.
Sum of current book value across every configured asset. Updates daily — no spreadsheet, no cron, no refresh button.
How much value your fleet loses every month, in your organization's currency. A real number to put in next year's budget.
Example: $3,400 / month
Ranked by percent-of-life-used. The assets closest to retirement surface first — before they surprise you.
Sum of book values for assets projected to reach 95% depreciation in the next 12 months. A defensible capex ask, straight from your CMMS.
Only admins see the money. Purchase prices, book values, and monthly depreciation are visible to organization and workspace admins only. Technicians and operators see maintenance data; admins see the capital picture. This mirrors how your finance team treats the data today — no extra permission model to learn.
All figures are computed on demand from your live asset data. No valuation snapshots, no nightly job, no ETL.
Two methods, one org-configurable rate, opt-in per asset. No accountant required to turn it on.
Pick the method per asset. Straight-line for vehicles, buildings, predictable wear. Declining-balance for IT, electronics, anything that loses value fastest in year one. Switch any time — the history recomputes automatically.
Default is 200% (double-declining, US GAAP standard). Change it once per organization and every declining-balance asset recomputes. No per-asset tax-rate voodoo.
Three fields per asset: purchase price, useful life in months, method. Leave them blank and the asset is simply excluded from the fleet book value — no errors, no warnings, no upsell. Capital overview ships on Free.
Ready to see what your fleet is worth?
Included on every plan. Capacity limits apply — features don't.
Four surfaces in the product where the capital picture appears. Technicians and non-admin members see none of this.
The four-metric summary on your dashboard. Updates daily, visible only to org and workspace admins.
A non-admin who views the asset history sees a lock icon in place of financial before/after values. Same trail, scoped to their role — no leak through the back door.
The Capital Overview widget stacks to a readable one-column view on any phone. Field admins get the same numbers the office does.
Note: Screenshots show the real A4B interface for an organization admin. Live widgets are fully interactive and update on page load.
Ready to see your fleet's capital picture?
Straight answers about how book value, depreciation methods, and admin-only visibility work in A4B.
Ready to know what your fleet is worth?
Trusted capabilities that modern maintenance teams rely on
Enterprise Security
Encrypted data & daily backups
Cloud Hosted
Professional infrastructure
Team Focused
Built for collaboration
Mobile Ready
Works anywhere, any device
Ready to modernize your maintenance approach?